Article Text

Abstract
Background: The cerebral metabolism of patients in the chronic stage of traumatic diffuse brain injury (TDBI) has not been fully investigated.
Aim: To study the relationship between regional cerebral metabolism (rCM) and consciousness disturbance in patients with TDBI.
Methods: 52 patients with TDBI in the chronic stage without large focal lesions were enrolled, and rCM was evaluated by fluorine-18-fluorodeoxyglucose positron emission tomography (FDG-PET) with statistical parametric mapping (SPM). All the patients were found to have disturbed consciousness or cognitive function and were divided into the following three groups: group A (n = 22), patients in a state with higher brain dysfunction; group B (n = 13), patients in a minimally conscious state; and group C (n = 17), patients in a vegetative state. rCM patterns on FDG-PET among these groups were evaluated and compared with those of normal control subjects on statistical parametric maps.
Results: Hypometabolism was consistently indicated bilaterally in the medial prefrontal regions, the medial frontobasal regions, the cingulate gyrus and the thalamus. Hypometabolism in these regions was the most widespread and prominent in group C, and that in group B was more widespread and prominent than that in group A.
Conclusions: Bilateral hypometabolism in the medial prefrontal regions, the medial frontobasal regions, the cingulate gyrus and the thalamus may reflect the clinical deterioration of TDBI, which is due to functional and structural disconnections of neural networks rather than due to direct cerebral focal contusion.
- DAI, diffuse axonal injury
- FDG-PET, fluorine-18-fluorodeoxyglucose positron emission tomography
- rCM, regional cerebral metabolism
- ROI, region of interest
- SPM, statistical parametric mapping
- TDBI, traumatic diffuse brain injury
Statistics from Altmetric.com
- DAI, diffuse axonal injury
- FDG-PET, fluorine-18-fluorodeoxyglucose positron emission tomography
- rCM, regional cerebral metabolism
- ROI, region of interest
- SPM, statistical parametric mapping
- TDBI, traumatic diffuse brain injury
Diffuse axonal injury (DAI) results in a wide range of neuropsychological and neurological deficits. Patients with DAI show complex combinations of disorders of memory, attention and executive functions, slowed information processing, modifications of behaviour and personality, and disturbed communication and consciousness.1 These disorders may impose a great burden on the family of the patient with a head injury and compromise psychosocial and vocational reintegration.2 Indeed, cognitive, behavioural and personality changes are major causes of the failure of patients with DAI to return to work.
In patients with DAI, MRI shows lesions in the corpus callosum, brain stem, internal capsule and the grey matter–white matter junction or the deep matter.3–5 Global MRI indices of patients with DAI, such as ventricular enlargement or atrophy of the white matter tracts (corpus callosum, fornix, internal capsule), correlate well with cognitive outcomes.6,7 In contrast, neurobehavioural disorders after DAI are reportedly poorly correlated with focal lesions that are detected by morphological neuroimaging techniques, such as CT or MRI.7,8
Cerebral metabolic imaging with positron emission tomography (PET) is useful in assessing the regional cerebral metabolism (rCM). PET studies on cerebral metabolism in patients with traumatic brain injury have been conducted at the acute9 or subacute–chronic stages,2,10,11 and those with region-of-interest (ROI) techniques have disclosed a close link between cognitive and behavioural disorders and decreased cortical metabolism in the prefrontal and cingulate cortices in patients with severe DAI.2
Patients with DAI have neurological, cognitive and behavioural dysfunctions, which become stable in the chronic stage. The relationship between these dysfunctions and rCM deviations has never been studied in detail. Limitations do exist in the assessment of rCM with ROI techniques. ROI techniques depend either on subjective assessment to establish differences from normal tracer distribution on functional activity maps or on the relatively arbitrary size, shape and placement of the ROIs. As a result, some areas of the brain may not be explored. Statistical parametric mapping (SPM) analysis is an alternative voxel-by-voxel analysis method that can avoid subjectivities. To investigate the relationship between cognitive and behavioural disorders, consciousness disturbance and rCM, we conducted a fluorine-18-fluorodeoxyglucose-PET (FDG-PET) study with SPM analysis in patients with traumatic diffuse brain injury (TDBI) at the chronic stage, which histopathologically is assumed to be mostly DAI.
MATERIALS AND METHODS
Patients
At the Chubu Medical Center for Prolonged Traumatic Brain Dysfunction, Gifu, Japan, in the past 4 years we have treated 202 consecutive patients with prolonged traumatic brain dysfunction caused by a high-velocity, high-impact injury in a motor vehicle accident. Of the 202 patients, 52 with diagnosed TDBI without large focal lesions were enrolled in this study. The 52 patients had disturbances of consciousness for more than 6 h, which were not due to mass lesions or ischaemic insults in the acute and subacute stages. For patients still having some degree of consciousness disturbance or cognitive dysfunction 6 months or more after head injury, we carried out neuropsychological assessments and FDG-PET studies to evaluate their correlations. We excluded patients with either a cortical contusion or haematoma of a total volume >10 cm3 at the acute stage on CT scan or MRI. Patients with a history of head injury, cerebral stroke, intracranial operation, psychiatric illness, alcoholism or drug misuse were also excluded.
Patients were divided into three groups according to their degree of consciousness disturbance. Group A had 22 patients (mean age 38.9 (SD 15.5) years, range 17–66 years; 13 men and 9 women) in a state with higher brain dysfunction; they were able to communicate through language, but had disturbed cognitive function (memory, attention and executive functions, slowed information processing, and modifications of behaviour and personality) on neuropsychological assessment (Wechsler Adult Intelligence Scale–Revised, Hasegawa Dementia Scale–Revised, 30-point Mini-Mental State Examination, Wechsler Memory Scale–Revised and Paced Auditory Serial Addition Test); all tests used were the Japanese language version. Each patient from group A had a score under 2 SDs from the control, in at least one of the 11 neuropsychological assessments (tables 1 and 2). Group B had 13 patients (mean age 29.8 (SD 8.2) years, range 21–50 years; 9 men and 4 women) in a minimally conscious state; they were not in a vegetative state but were unable to communicate consistently;12 their number was not sufficient for testing neuropsychological assessment with consistently verbal or gestural communication impairments (table 1). Group C had 17 patients (mean age 30.8 (SD 13.7) years, range 18–59 years; 10 men and 7 women) in a vegetative state (table 1).
Demographics of patients and controls
Neuropsychological data of group A patients and normal controls
Normal controls
Thirty healthy adult volunteers (mean age 34.7 (SD 8.9) years, range 21–49 years; 21 men and 9 women) were recruited as normal controls. None had a history of head injury or a major neurological, physical or psychiatric disorder, including drug and alcohol misuse. Tables 1 and 2 summarise the demographic data and the results of neuropsychological assessment of normal controls.
All participants (patients and controls) gave prior written informed consent (for patients who were unconscious, consent was obtained from a relative or guardian). The research committee of Kizawa Memorial Hospital Foundation approved the protocol.
PET examination
The PET scanner used in this study was an ADVANCE NXi Imaging System (General Electric Yokokawa Medical Systems, Hino-shi, Tokyo, Japan), which provides 35 transaxial images at 4.25 mm intervals. The in-plane spatial resolution (full width at half maximum) was 4.8 mm. The scan mode was the standard two-dimensional mode. Participants were placed in the PET scanner so that slices were parallel to the canthomeatal line. Immobility was checked by alignment of three laser beams, with lines drawn on the participants’ faces. Participants fasted for at least 4 h before injection of FDG. A dose of 0.12 mCi/kg of FDG was injected intravenously through the cubital vein over a period of 1 min. The participants were comfortably seated with their eyes open and environmental noises were kept to a minimum for about 40 min. After a 40 min rest, a germanium-68–gallium-68 rotating pin source was used to obtain 3 min transmission scans. A static PET scan was carried out continuously for 7 min. A static scan was reconstructed with corrections for photon attenuation with data from the transmission scans, dead time, random and scatter.13
Data analysis
Images were processed and analysed on a Microsoft workstation with MATLAB software (Mathworks, Sherborn, Massachusetts, USA) and SPM V.99 software (courtesy of the Functional Imaging Laboratory, Wellcome Department of Cognitive Neurology, University College London, London, UK).
The images were first subjected to spatial transformations so that they matched a template that conformed to the space derived from standard brains from the Montreal Neurological Institute (http://www.bic.mni.mcgill.ca) and were converted to the space of the stereotactic atlas of Talairach and Tournoux.14 These images were then smoothed with a gaussian low-pass filter of 10 mm in plane to minimise noise and improve between participant spatial alignment. After smoothing, an appropriate linear statistical model was applied to each voxel. Finally, statistical inference was used to correct for the multiple dependent comparisons by using the theory of gaussian fields.
Once the images had been spatially normalised and smoothed, the general linear model15 was used to carry out the appropriate voxel-by-voxel univariate statistical tests in the form of group comparisons (two-sample t test) between TDBI groups (groups A, B and C) and separately against normal controls (SPM99). Image intensity between participants was normalised to prevent interparticipant variability in cerebral tracer uptake from masking regional changes. This was carried out by the technique of proportional scaling.16 Proportional scaling simply scales each image according to a reference count, global brain activity or counts in a specific region. The image data were therefore scaled proportionally to the mean global brain activity.
The grey matter threshold was set to 0.8, as this seemed to segment the brain regions effectively from tissues outside the brain and from the ventricles. Subsequently, the analysis produced a t statistic for each voxel, as specified by the contrast (which expresses hypotheses from effects defined by the design matrix or statistical model), which constituted the statistical parametric map, SPM{T}. The SPM{T} map was then transformed to the unit normal distribution to give a gaussian field or SPM{Z}.
The threshold for the statistical parametric maps for comparison of patients having TDBI with normal controls was set at the default probability of puncorrected⩽0.001. No extent threshold was applied to the SPM{T} maps, which therefore showed all data surviving the height threshold. The resulting foci were then described in terms of spatial extent (k) and peak height (u). The significance of each region was estimated by using distributional approximations from the theory of gaussian fields, giving the probability (correcting for the multiple non-independent comparisons) of observing a voxel with a t>u purely by chance across the whole brain, pcorrected (t⩾u). Regions were interpreted and reported as significant if they contained voxels with a value of pcorrected⩽0.05. Therefore, significance was reported for p values without correction—that is, puncorrected (t⩾u).17 These areas were displayed as maximum-intensity projections (glass brain) in the three orthogonal projections.
We applied this technique to a set of FDG-PET images in patients with TDBI (groups A, B and C) and normal controls to investigate the applicability of voxel-based methods in differentiating between these groups.
RESULTS
Of the 202 patients, 52 patients (32 men and 20 women; mean age 33.2 (SD 12.5) years) for whom consent was obtained (for unconscious patients, consent was obtained from a relative or guardian) were enrolled in this study. The mean interval between head injuries and initiation of these studies was 18.6 (SD 16.2) months. We observed no significant difference in age (p = 0.058) and interval between head injuries and initiation of assessments (p = 0.367) among the groups (Kruskal–Wallis test; table 1).
We found significant differences in all the assessments between group A patients and normal controls (table 2). Group A patients had cognitive dysfunction and neurobehavioural impairment, and psychological maladjustment without physical deficits, although they could communicate with others verbally.
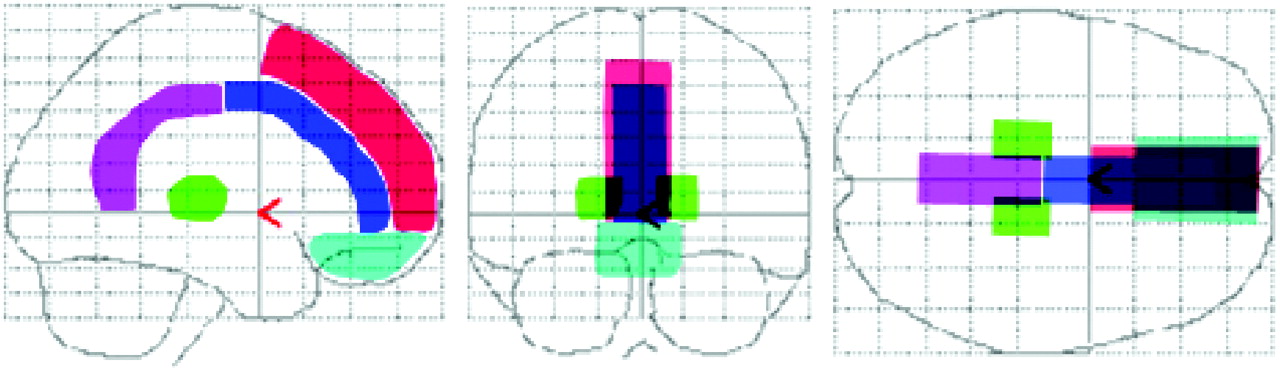
We defined the structural outlines of the medial prefrontal region, medial frontobasal region, the anterior and posterior regions of cingulate gyrus and thalamus on a glass brain in three orthogonal planes for visual inspection (fig 1).

Structural outlines of the medial prefrontal regions (red), medial frontobasal regions (light blue), cingulate gyrus (anterior (dark blue) and posterior (pink) regions) and thalamus (green) on a glass brain in three orthogonal planes (lateral, anterior and superior views).
SPM analysis showed marked bilateral hypometabolism in the medial prefrontal region, medial frontobasal region, the anterior and posterior regions of cingulate gyrus and thalamus in all patients from groups A, B and C, when compared with normal controls (fig 2). When compared with patients from group A, those from group B showed more widespread and prominent hypometabolism (fig 2A,B). Furthermore, when compared with patients from group B, those from group C showed more widespread and prominent hypometabolism, especially in the medial prefrontal and medial frontobasal regions (figure 2B,C).

Upper row: summary of statistical parametric mapping (SPM) results displayed on a glass brain in three orthogonal planes (lateral, anterior and superior views) at puncorrected⩽0.001. The shaded areas represent statistical evidence for a reduction in metabolism in patients with traumatic diffuse brain injury (TDBI) compared with normal controls. Lower row: summary of SPM results shown on the left medial, anterior and superior views of a volume-rendered spatially normalised MRI at puncorrected⩽0.001. The red areas are statistical evidence for hypometabolism in patients with TDBI compared with normal controls. (A) Group A patients v normal control subjects, (B) group B patients v normal controls, (C) group C patients v normal controls. Patients from each group consistently displayed marked hypometabolism bilaterally in the medial prefrontal regions, medial frontobasal regions, cingulate gyrus and thalamus. Hypometabolism in these regions in group C patients was the most widespread and prominent among the three groups, and hypometabolism in group B patients was more widespread and prominent than that in group A patients.
Table 3 lists the peaks of the most significant voxels (pcorrected⩽0.05) and shows the location of the voxels within each cluster. When compared with normal controls, patients from group A had significant glucose metabolism reductions in the thalamus, cingulate gyrus, rectal gyrus and superior temporal gyrus (table 3). Metabolism reductions in patients from group B were seen in the thalamus, cingulate gyrus, lingual gyrus, parahippocampal gyrus, caudate nucleus, rectal gyrus, subcallosal gyrus, fusiform gyrus, superior frontal gyrus, cerebellum and transverse temporal gyrus (table 4). Metabolism reductions in patients from group C were seen in the thalamus, cingulate gyrus, cerebral peduncle, hypothalamus, subcallosal gyrus, inferior frontal gyrus and medial frontal gyrus (table 5). We detected no significant regional hypermetabolism in patients from groups A, B or C compared with normal controls.
Location and peaks of significant reduction in glucose metabolism in group A patients compared with normal controls
Location and peaks of significant reduction in glucose metabolism in group B patients compared with normal controls
Location and peaks of significant reduction in glucose metabolism in group C patients compared with normal controls
DISCUSSION
Statistical image analysis
ROI techniques have disclosed cortical hypometabolism in the prefrontal region and cingulate gyrus in patients with severe DAI.2 In a single-photon emission computed tomography study, a group of patients with diffuse head injury were shown to have low blood flow in the frontal and temporal lobes, including the cingulate gyrus and thalamus, by using SPM software.18 Our patients showed marked glucose hypometabolism bilaterally in the medial prefrontal regions, medial frontobasal regions, cingulate gyrus and thalamus. SPM statistical image analysis has played an important part in FDG-PET image interpretation, because it allows visualisation of the results of quantitative analysis of the abnormal metabolic distribution in the brain of a patient. A disadvantage of SPM is that atrophy may be misanalysed as TDBI.
Relationship with cortical disconnection
The cingulate gyrus is a principal component of the limbic system, and its anterior and posterior parts possess different thalamic and cortical connections,19 have different cytoarchitectures and subserve distinctive functions.20 The anterior cingulate gyrus can be divided into discrete anatomical and behavioural subdivisions: the affective division and the cognitive division.21 The affective division includes the areas of Brodmann 25 and 33 and the rostal area of Brodmann 24, and has a role in emotion and motivation. The cognitive division includes caudal areas of Brodmann 24 and 32 and has a role in complex cognitive and attentional processing.21–23 Previous research indicates that major regions of age-related decline remain prominent in the prefrontal cortex as well as in the anterior cingulate gyrus.24
On the other hand, the posterior cingulate gyrus plays a part in orientation within, and interpretation of, the environment,19,25 and has connections and behavioural attributes distinct from those of the anterior cingulate gyrus. Therefore, the functions of these divisions are probably coordinated.20 The posterior cingulate gyrus also has dense connections with the medial temporal memory system. These communications may contribute to the role of the posterior cingulate gyrus in orientation.22 The posterior cingulate gyrus is a major locus that participates functionally early in the course of Alzheimer’s disease.26
The thalamus is also a principal component of the limbic system and the ascending reticular activating system. Therefore, the thalamus has distinct connections with the cingulate gyrus, the reticular formation and the cerebral cortex.
Numerous anatomical connections are found between the medial parietal region (precuneus) or posterior cingulate and the medial prefrontal region (medial frontal region) or anterior cingulate, and these regions are functionally integrated in reflective self-awareness and the resting conscious state.27–29
In patients with DAI, axonal damage in the white matter, corpus callosum and the region of the superior cerebellar peduncle is common.30 The corpus callosum, in which front-to-back organisation of fibre tracks corresponds with frontal-to-occipital anatomy, this organisation is distributed in the cingulate gyrus.31 In our study, glucose hypometabolism was observed bilaterally in the medial prefrontal regions, medial frontobasal regions, cingulate gyrus and thalamus in patients with TDBI. These results may provide strong evidence that the white matter tract, leading to a cortical disconnection that results in cognitive decline and consciousness disturbance, may be disrupted in patients with TDBI.
Relationship with severity of consciousness disturbance
Consciousness is a multifaceted concept that can be divided into two main components: arousal (wakefulness or vigilance) and awareness (awareness of the environment and of the self).32 Arousal is supported by several brain stem neurone populations that directly project to both thalamic and cortical neurones.33 Therefore, a decline of either the brain stem or both cerebral hemispheres may reduce wakefulness. Awareness is thought to be dependent on the functional integrity of the cerebral cortex and its subcortical connections; each of its many parts is located, to some extent, in anatomically defined regions of the brain.34,35 Unfortunately, consciousness cannot be measured objectively by any machine. Its estimation requires the interpretation of several clinical signs. Many scoring systems have been developed for the quantification and standardisation of the assessment of consciousness.12
We divided patients with TDBI into three groups according to their degree of consciousness disturbance. Group A patients had full arousal and awareness; group B patients had full arousal and some degree of awareness disturbance; and group C patients had full arousal with unawareness.
In our study, hypometabolism in the medial prefrontal regions, medial frontobasal regions, cingulate gyrus and thalamus was more prominent, with clinical deterioration in consciousness in the chronic stage. This result may provide strong evidence that hypometabolism in these regions influences the severity of cognitive dysfunction and consciousness disturbance in patients with TDBI.
Conclusions
In patients with TDBI at the chronic stage, consciousness disturbance or cognitive dysfunction is strongly suggested to be caused by bilateral regional glucose hypometabolism in the medial prefrontal regions, medial frontobasal regions, cingulate gyrus and thalamus. In addition, hypometabolism was more widespread and prominent, with a deterioration of consciousness or cognitive dysfunction. This hypometabolism may be the result of the functional and structural cortical disconnections of the neural networks in the brain rather than of direct cerebral focal contusion, because no extensive brain damage was detected in these regions on CT or MRI.
Acknowledgments
We thank Mr S Fukuyama, Mr Y Kasuya and Mr N Yamamoto (Kizawa Memorial Hospital, Minokamo City, Gifu, Japan) for technical support.
REFERENCES
Footnotes
-
Published Online First 20 March 2006
-
Competing interests: None declared.